tze ching clarice lam
MA data visualisation
London College of Communication UAL
Graduates: 2022
Specialisms: Digital / Visual Comm / Film / Graphic Design / Design Research
My location: London, United Kingdom

tze ching clarice lam

First Name: tze ching clarice
Last Name: lam
University / College: London College of Communication UAL
Course / Program: MA data visualisation
Graduates: 2022
Specialisms: Digital / Visual Comm / Film / Graphic Design / Design Research
My Location: London, United Kingdom
Website: Click To See Website
About
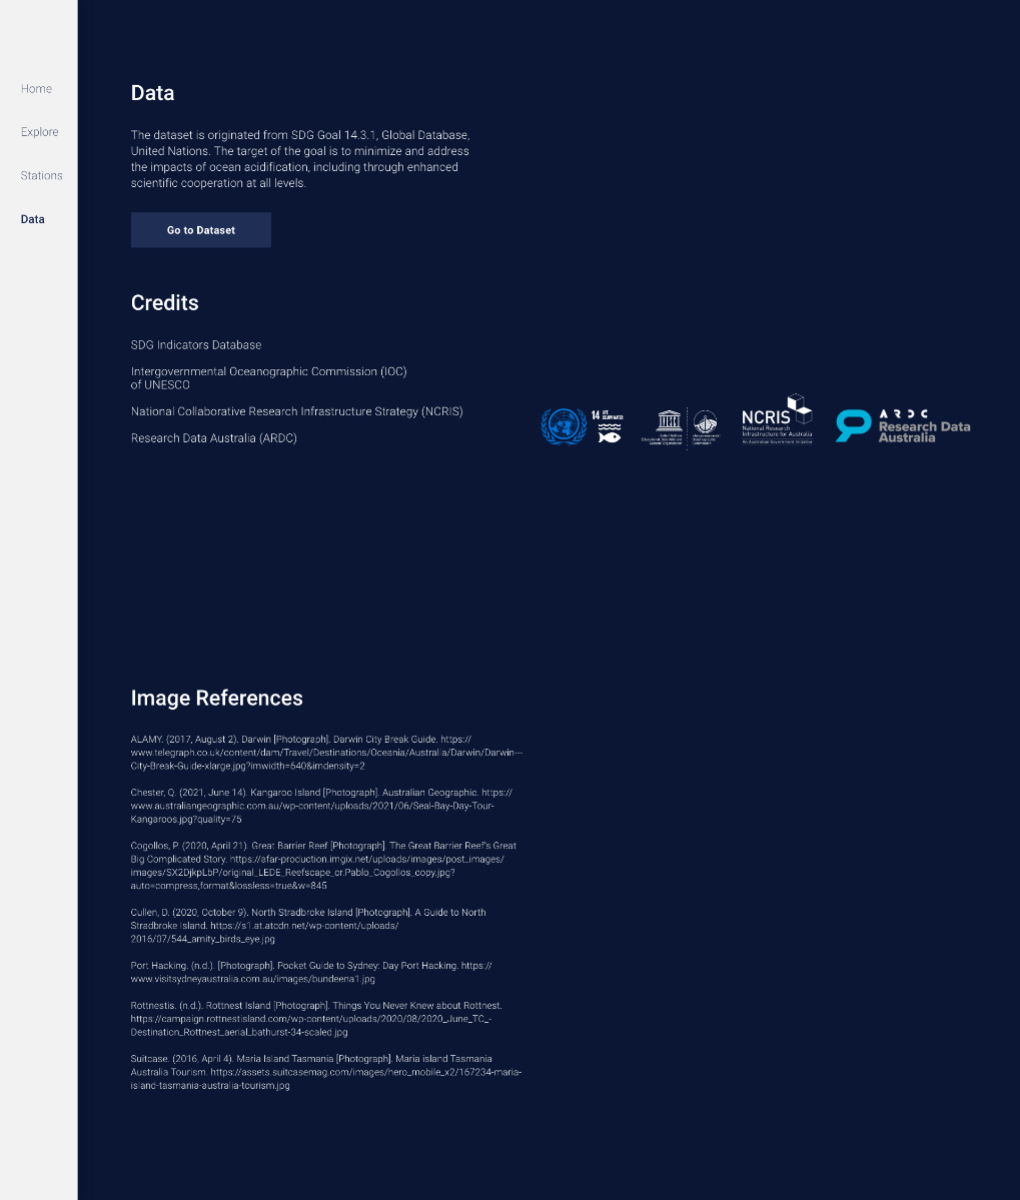
SDG 14: Marine Acidity in Australia
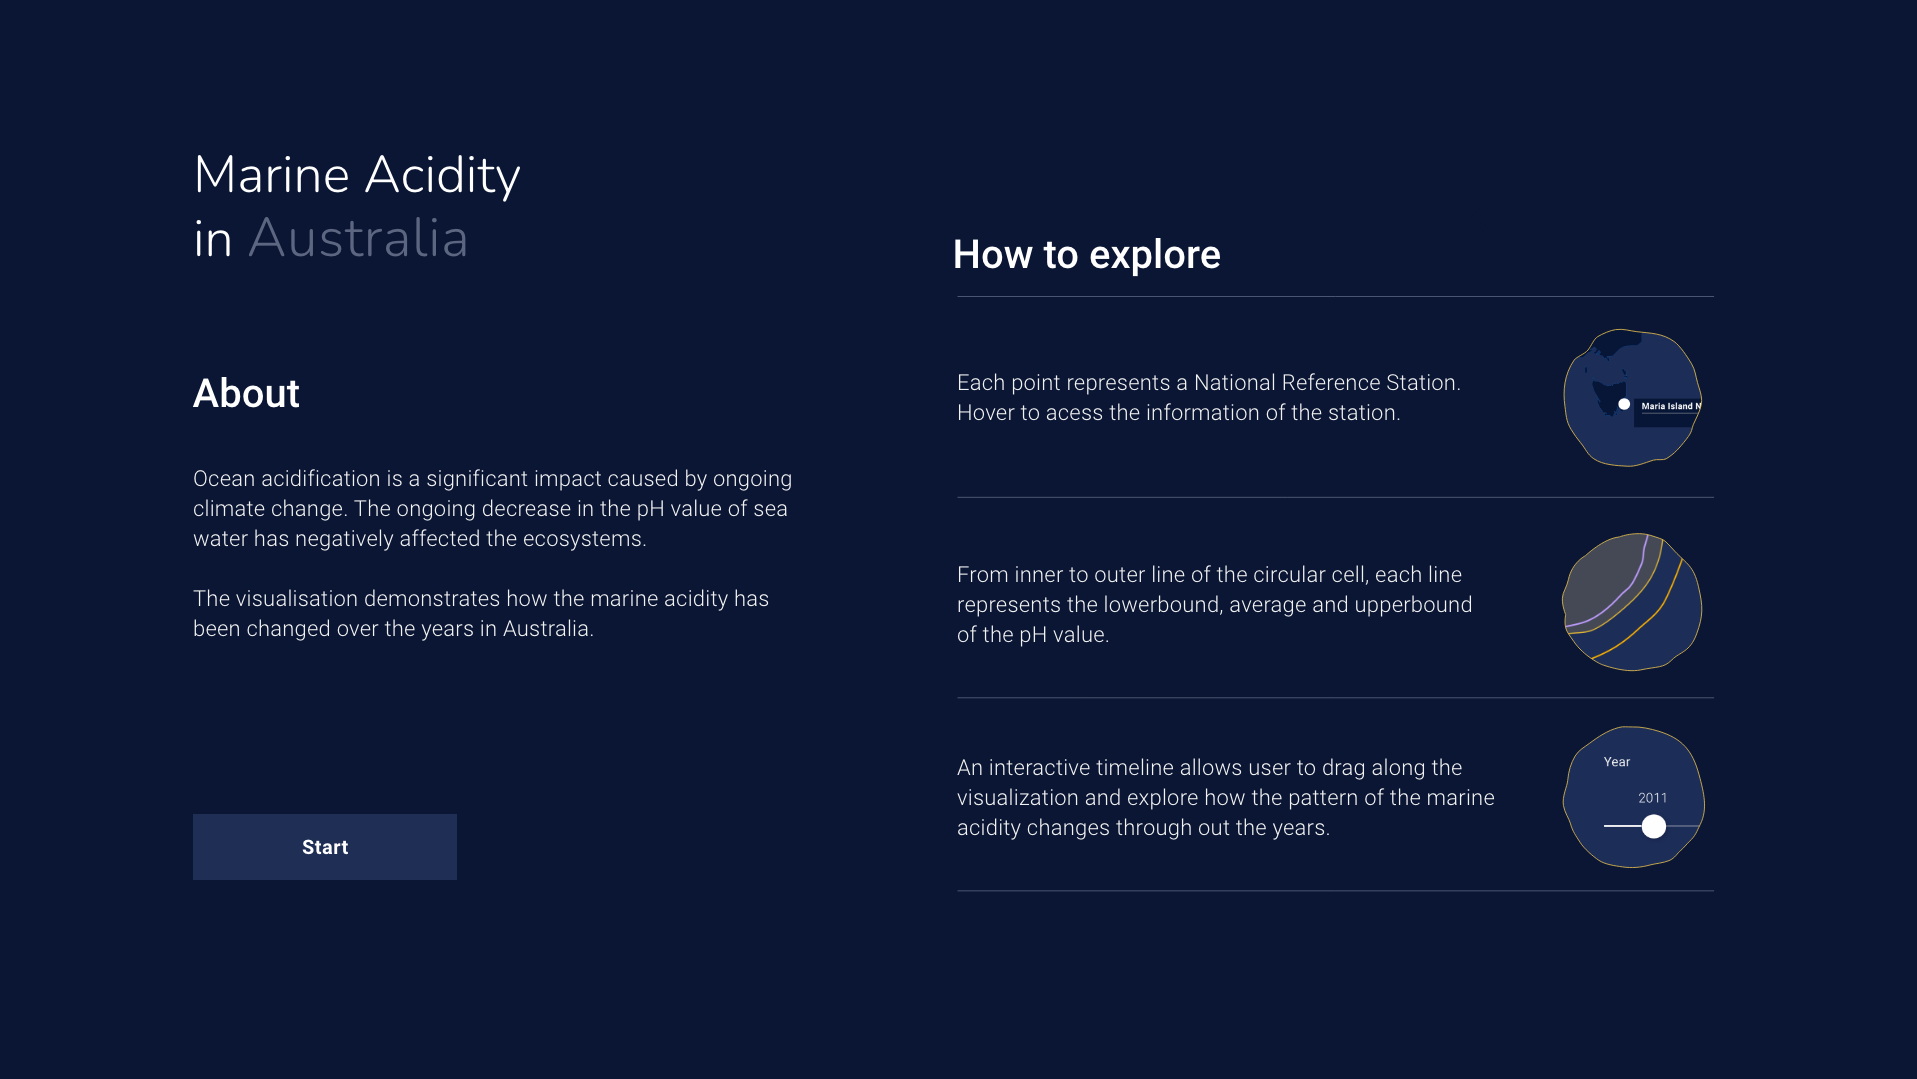
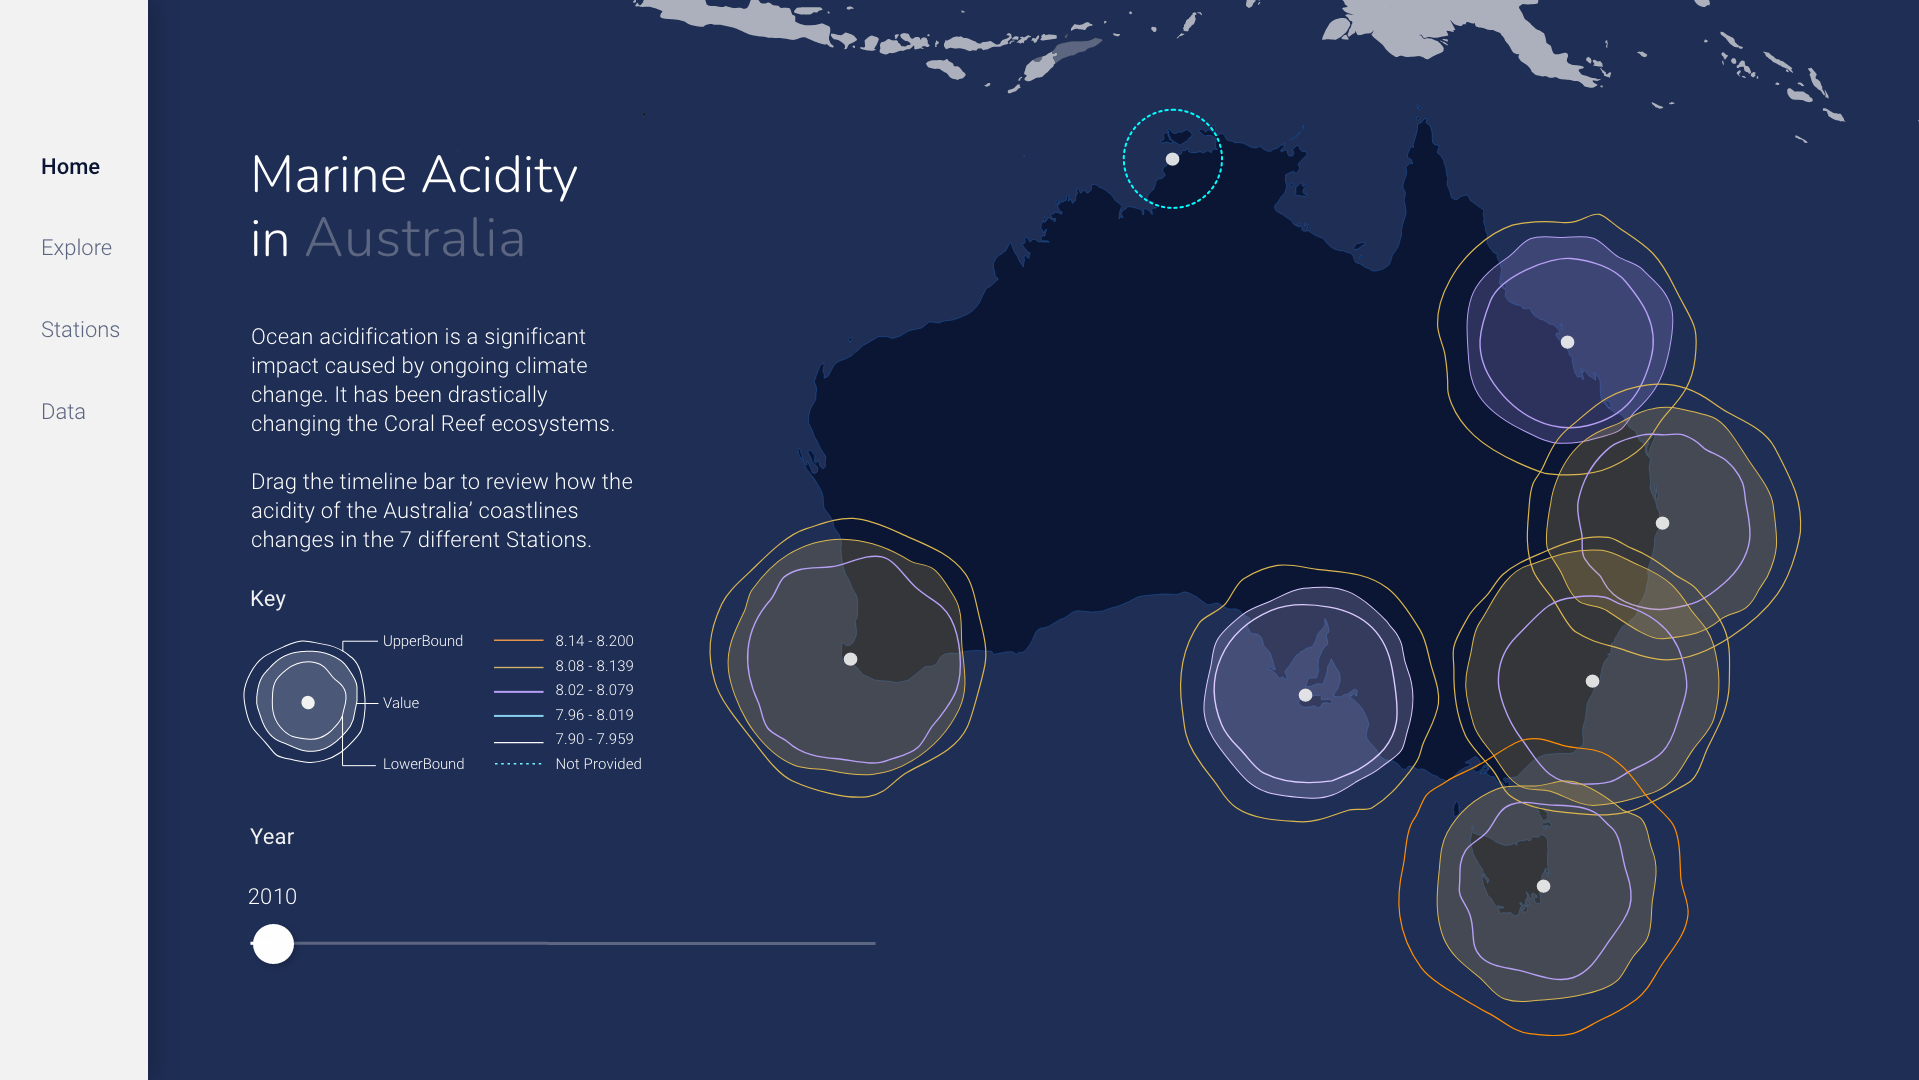
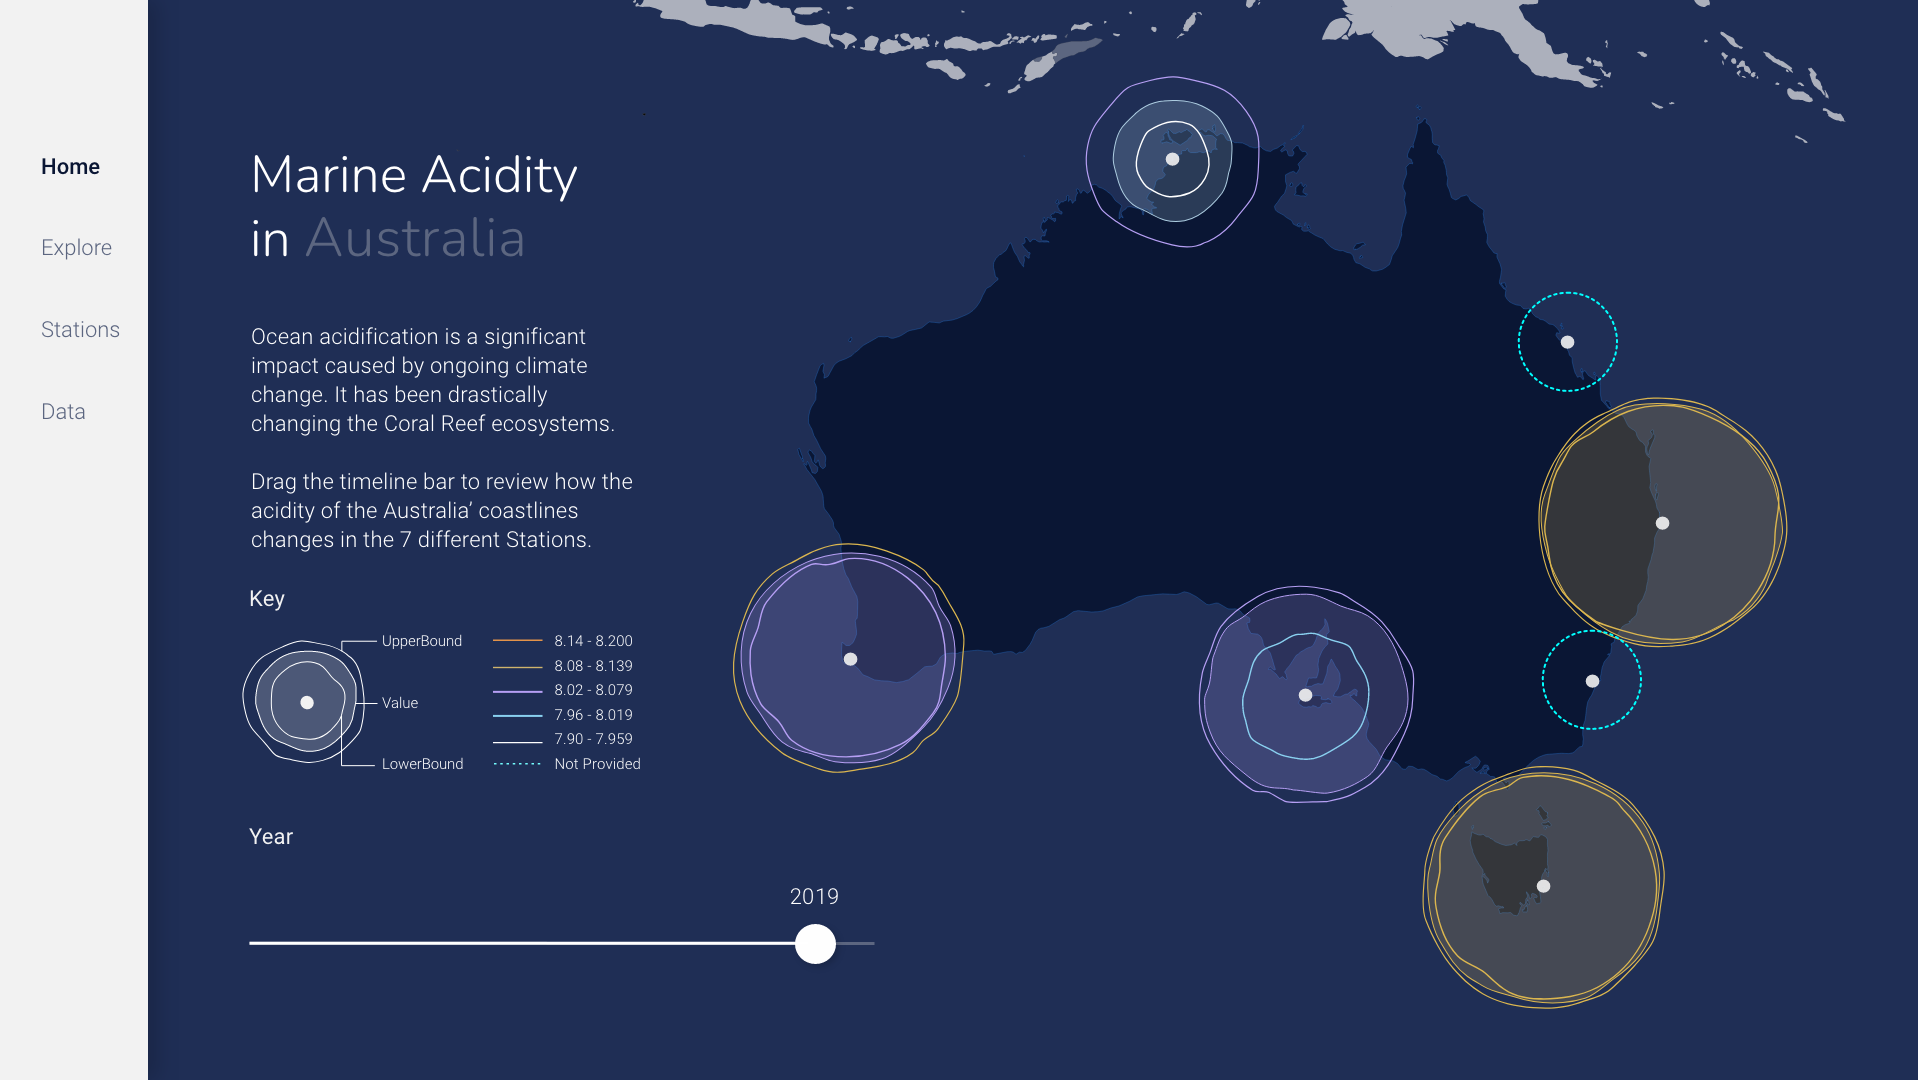
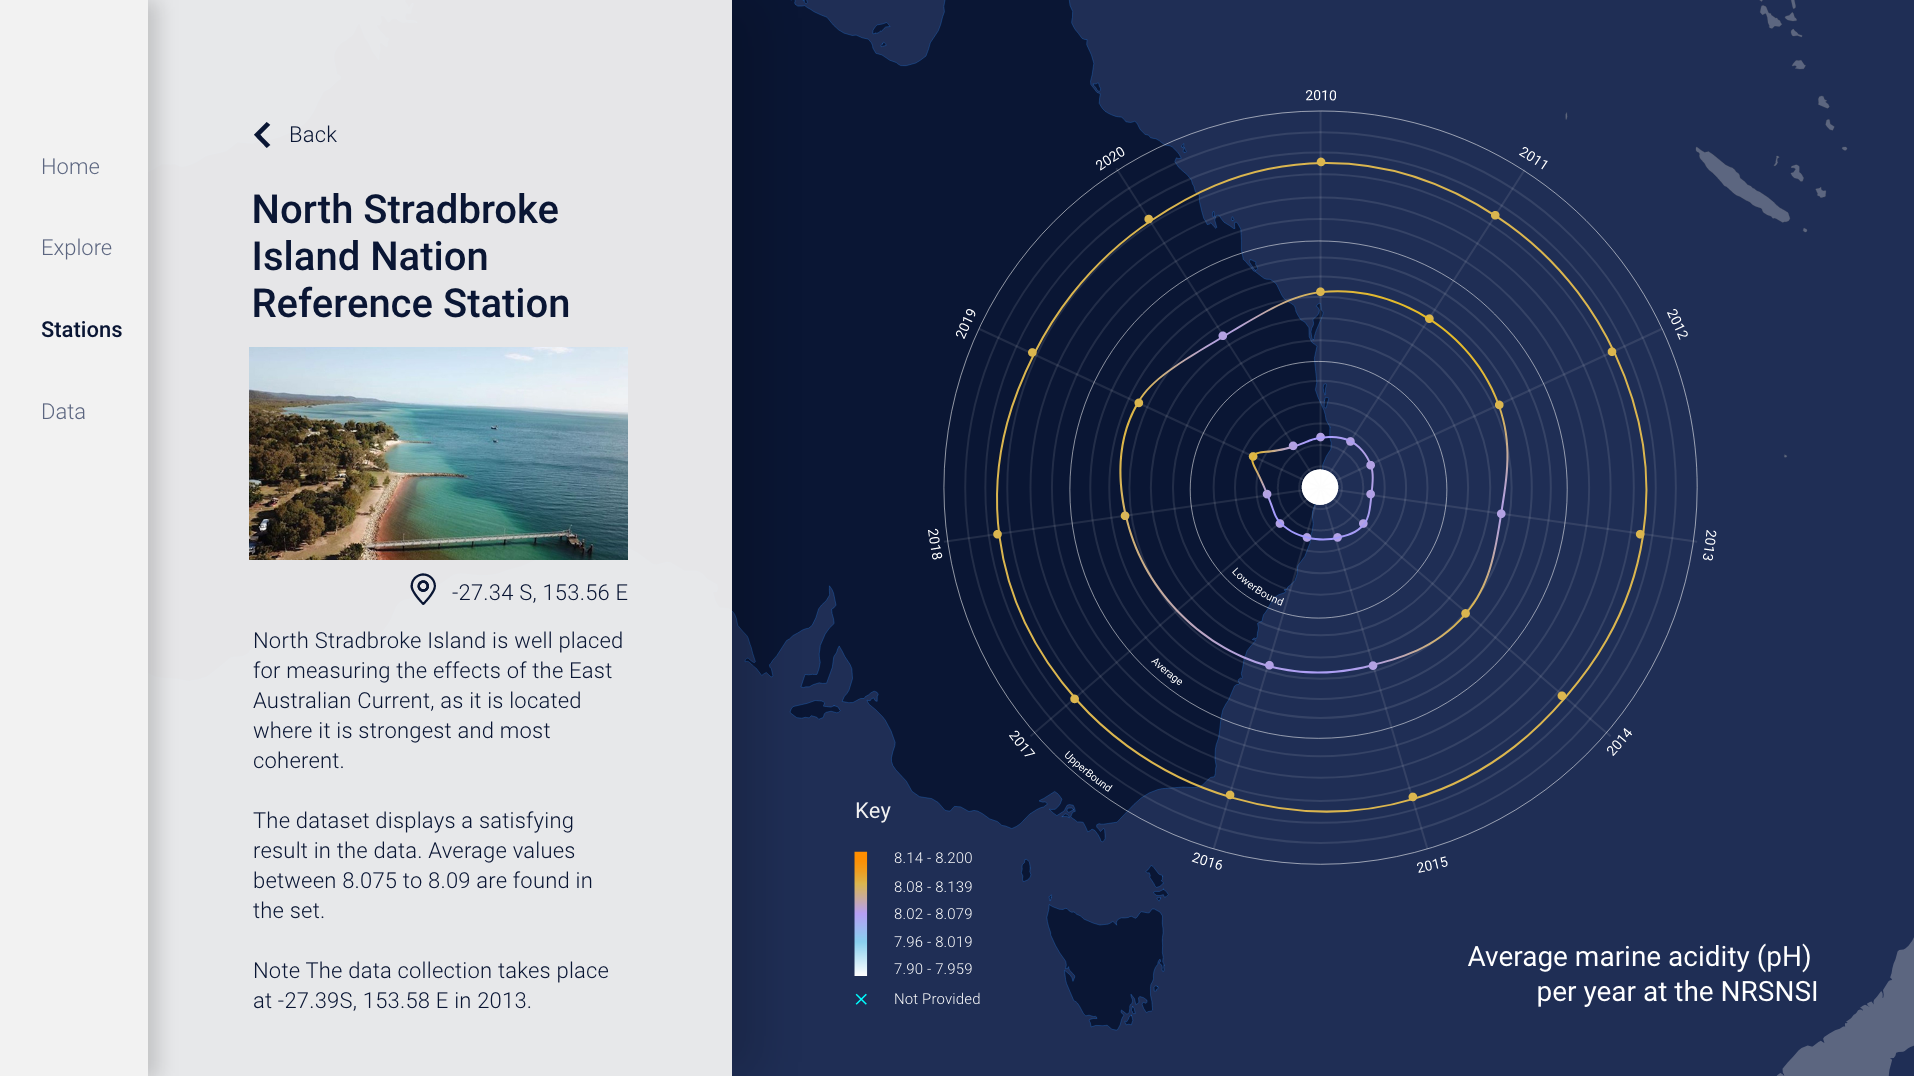
The interactive project displays the Marine Acidity condition in Australia throughout the years and aims to reveal that threatened marine life is closely linked with marine acidification. Inspired by the organic and colourful coral reef system under the sea, I tend to present the data in the form of irregular shapes. Moreover, colour plays an important role in this project. Research has shown that marine acidity will lead to the bleaching of the colourful coral reefs. Inspired by such a concept, I decided to select a set of gradient colours. The more vibrant the colour, it represents the higher the pH value in the dataset. In contrast, the paler and brighter the colour, the lower pH value is represented. As the end product, the data flows and moves when dragging the timeline bar, creating an illusion of how the marine acidity changes over time. prototype here: https://xd.adobe.com/view/4ef7ab08-10a6-412f-b249-5150188e2314-1ba4/?fullscreen&hints=off Data sources from SDG14.

